
Understanding Support and Resistance in Market Analysis
Support and resistance remain among the most fundamental concepts in technical market analysis, yet they are also among the most misunderstood. For readers of FinancialDailys, who follow developments across equities, fixed income, currencies, commodities, and digital assets, a nuanced grasp of these levels is essential not only for short-term trading decisions but also for long-term portfolio construction, risk management, and behavioral insight into how global markets actually function.
This article explores what support and resistance are, why they form, how professionals across major financial centers apply them, and how these concepts are evolving in an era shaped by algorithmic trading, artificial intelligence, and increasingly integrated global markets. While the principles are timeless, the tools and data available to investors in the United States, Europe, Asia, and beyond have never been more sophisticated, and understanding how to integrate these levels into a disciplined process can materially improve decision-making.
What Are Support and Resistance?
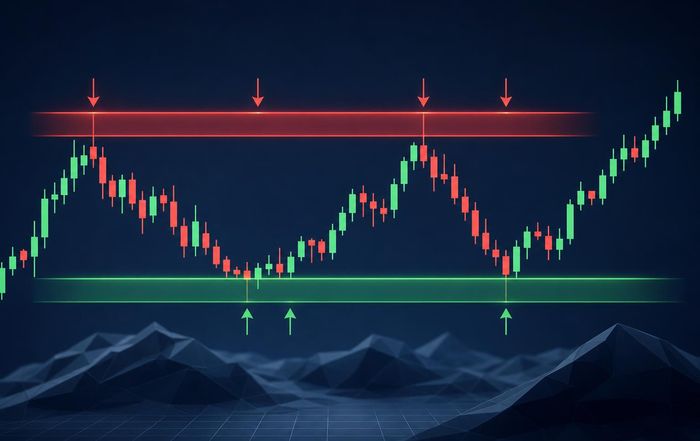
In classical technical analysis, support is generally defined as a price level where a downtrend tends to pause or reverse because buying interest emerges, while resistance is a level where an uptrend tends to stall or reverse as selling pressure increases. In practice, these are not razor-thin price points but rather zones where market participants collectively reassess value, risk, and opportunity.
Support and resistance can be observed across asset classes. Equity traders watch them on indices like the S&P 500, FTSE 100, and DAX, currency strategists monitor them on pairs such as EUR/USD or USD/JPY, and commodity analysts examine them on benchmarks like Brent crude or gold futures. Even in digital assets, where volatility is higher and historical data shorter, levels of support and resistance on major tokens such as bitcoin and ether are tracked daily by institutional desks and retail investors alike.
Authoritative educational resources, including CFA Institute and Investopedia, describe support and resistance as core building blocks of technical analysis, often used alongside trendlines, moving averages, and volume analytics. These levels do not guarantee a particular price outcome; instead, they highlight areas where probabilities may shift because of the way investors react to price history, news, and macroeconomic signals.
For readers who follow the dedicated markets coverage at FinancialDailys, especially through its markets and stocks sections, support and resistance charts often underpin commentary on key index levels, sector rotations, and breakout or breakdown scenarios.
Why Do Support and Resistance Levels Form?
Support and resistance arise from the interaction of human behavior, institutional constraints, and market microstructure. They are ultimately expressions of collective psychology, anchored by real flows of capital.
One driver is anchoring to historical prices. Many investors remember where they bought or sold a security, particularly when that level coincides with a peak or trough. When price returns to these zones, investors who previously experienced losses may choose to exit at breakeven, creating selling pressure near former highs (resistance), while those who missed earlier opportunities may be eager to buy near prior lows (support).
Another factor is the behavior of large institutional investors, including pension funds, insurance companies, and sovereign wealth funds, which frequently operate with pre-defined rebalancing rules and risk budgets. When a stock index or bond yield approaches certain levels that affect portfolio risk metrics or liability matching, institutional flows can cluster around these areas and reinforce support or resistance. Research from organizations such as BlackRock and Vanguard often highlights how systematic rebalancing and factor exposures can influence market dynamics at key thresholds.
Round numbers also play a role. Major indices nearing psychologically significant levels-such as 5,000 on the S&P 500 or 40,000 on the Dow Jones Industrial Average-often attract heightened media coverage and investor attention, which can amplify trading around those areas. While there is no mechanical reason why a round number should matter, the clustering of orders and expectations can cause it to behave like support or resistance.
For readers of FinancialDailys, this behavioral dimension aligns closely with the broader themes discussed in its economy and consumer coverage, where sentiment, expectations, and confidence indicators frequently shape market outcomes as much as raw economic data.
Key Types of Support and Resistance
Support and resistance can be derived from several technical frameworks. Professional analysts rarely rely on a single method; instead, they look for confluence, where multiple techniques point to similar levels.
Horizontal Price-Based Levels
The most intuitive form of support and resistance is horizontal, based on previous swing highs and lows. When a market repeatedly reverses near the same price, that level gains significance. For example, if a stock fails to break above a particular price on multiple occasions, traders may view that area as strong resistance until a decisive breakout occurs.
Many trading platforms and educational portals, including TradingView and StockCharts, provide tools for drawing horizontal lines across historical price data, enabling investors to visually identify such zones. These levels are widely used across geographies, from US and European equity markets to Asian indices such as the Nikkei 225 and Hang Seng.
Trendlines and Channels
Trendlines are diagonal representations of support and resistance, connecting a series of higher lows in an uptrend or lower highs in a downtrend. Channels extend this concept by pairing parallel support and resistance lines, capturing the price's typical range within an established trend.
Technical analysis bodies such as CMT Association emphasize that trendlines should be validated by multiple touches and significant price reactions. A break of a well-established trendline, particularly when accompanied by rising volume, can signal a potential trend reversal or acceleration.
Moving Averages as Dynamic Levels
Moving averages, such as the 50-day and 200-day simple moving averages, often act as dynamic support and resistance, especially in liquid markets with broad institutional participation. When price approaches a widely followed moving average, investors who view it as a fair-value benchmark may step in, causing price reactions that resemble support or resistance.
Major indices and large-cap stocks in markets like the United States, United Kingdom, Germany, and Japan regularly see institutional buying or selling intensify around these averages. Market commentary from sources like Bloomberg and Reuters frequently references how the S&P 500 or Nasdaq Composite reacts around its 200-day moving average, underscoring the level's practical influence.
Fibonacci and Other Derived Levels
Some analysts use Fibonacci retracements and extensions, based on ratios such as 38.2%, 50%, and 61.8%, to estimate potential support and resistance after significant moves. While the theoretical justification for these ratios is debated, their widespread use can create a self-reinforcing effect, as traders place orders near these levels.
Reputable educational sources, including The Balance and Morningstar, typically present Fibonacci tools as supplementary rather than primary, recommending that investors combine them with more straightforward price and volume analysis.
The Role of Volume and Market Liquidity
Price levels gain or lose significance depending on the trading volume and liquidity associated with them. A support level that holds during heavy selling pressure is more meaningful than one tested on light volume. Similarly, a breakout above resistance accompanied by strong volume is generally viewed as more credible than a low-volume move.
Modern market structure, with its fragmentation across exchanges and alternative trading systems, makes volume analysis more complex. Data from venues such as NYSE, Nasdaq, and major European and Asian exchanges must often be aggregated to obtain a complete picture. Nonetheless, the principle remains: the deeper the liquidity and the more capital transacts at a given level, the stronger that support or resistance is likely to be perceived.
For readers of FinancialDailys, who follow finance and banking developments closely, understanding liquidity conditions is particularly relevant when analyzing financial stocks, bond markets, and cross-border capital flows, where support and resistance can be influenced by regulatory changes, central bank operations, and institutional positioning.
Support and Resistance Across Asset Classes
Support and resistance behave differently across asset classes because of differences in liquidity, leverage, trading hours, and participant profiles.
In developed equity markets such as the United States, United Kingdom, and Europe, large-cap stocks and major indices tend to respect well-established levels more consistently, as they are followed by a broad base of institutional and retail investors. In contrast, small-cap and micro-cap equities may exhibit more erratic behavior, with levels failing more frequently due to thinner liquidity and higher volatility.
In fixed income, support and resistance often appear on yields rather than prices. Government bond yields in the United States, Germany, Japan, and the United Kingdom frequently encounter resistance near key round numbers or historical highs, reflecting shifts in inflation expectations, monetary policy outlooks, and risk appetite. Analysts at organizations such as Bank for International Settlements and International Monetary Fund regularly highlight how yields cluster around certain ranges, influencing global asset allocation.
Foreign exchange markets, being highly liquid and heavily influenced by macroeconomic data, central bank policy, and cross-border trade, also show well-defined support and resistance. Pairs involving major currencies such as the US dollar, euro, yen, pound sterling, and Swiss franc are closely watched by global investors, with price levels often coinciding with previous intervention zones or policy signals from central banks like the Federal Reserve and European Central Bank.
Commodities and energy markets, including crude oil, natural gas, and industrial metals, exhibit support and resistance influenced not only by financial flows but also by physical supply and demand, inventory data, and geopolitical events. Coverage in the trade and world sections of FinancialDailys frequently explores how price levels interact with production decisions by major exporters and policy responses from importing nations.
Digital assets present a more volatile landscape, with support and resistance levels sometimes breached rapidly. However, as institutional participation has grown, particularly through listed futures, exchange-traded products in regions where they are permitted, and custodial services, some of the more liquid cryptocurrencies are beginning to exhibit behavior more akin to traditional risk assets, reinforcing the value of careful level analysis.
Integrating Fundamentals and Technical Levels
While some market participants focus almost exclusively on charts, many professional investors combine support and resistance with fundamental analysis. This integration is particularly important for long-term allocators, family offices, and wealth managers serving clients across North America, Europe, and Asia-Pacific.
For example, an investor may identify a fundamentally attractive company, supported by strong balance sheet metrics, competitive positioning, and positive cash flow trends, using research from sources such as S&P Global or MSCI. Support and resistance can then help refine entry and exit points, position sizing, and stop-loss placement. Buying near a well-defined support zone, when fundamentals remain intact, can improve the risk-reward profile, while recognizing resistance levels can guide profit-taking or hedging.
Macro investors, including those who follow the detailed investing and business analysis at FinancialDailys, often use support and resistance on indices, currencies, and bond yields to time implementation of broader economic views. A thesis about disinflation, for instance, may lead to a constructive view on growth-sensitive equities, but the actual deployment of capital might be staged around key support zones in major benchmarks.
Risk Management and Position Sizing
Support and resistance are particularly valuable in risk management, because they help define where a trade thesis is likely to be invalidated. If an investor buys a stock expecting a rebound from a support level and price breaks decisively below that level on high volume, it may indicate that the underlying assumptions are no longer valid. This provides a logical point for reducing or closing the position.
Position sizing frameworks, often discussed in professional risk management literature and on platforms such as CME Group and OCC, frequently rely on the distance between entry price and support or resistance levels to determine how much capital to allocate. The wider the distance to a logical stop level, the smaller the position typically needs to be to maintain consistent risk across trades or investments.
For multi-asset portfolios, this discipline is crucial. Readers of FinancialDailys who monitor property, equities, bonds, and alternative assets can use support and resistance to maintain coherent risk across different instruments, ensuring that no single position or asset class overwhelms the overall portfolio if critical levels fail.
Algorithmic Trading, AI, and the Evolution of Support and Resistance
Advances in algorithmic trading and artificial intelligence have changed how markets interact with support and resistance, but they have not eliminated their relevance. Quantitative funds and high-frequency trading firms increasingly incorporate order book data, liquidity metrics, and complex pattern recognition into their strategies, leading to more dynamic and sometimes faster reactions around key levels.
Research from institutions such as MIT Sloan and London Business School has explored how machine learning models can identify non-linear relationships in price data, including evolving support and resistance structures that may not be obvious to the human eye. These models can adapt more quickly to regime changes, such as shifts in volatility or correlations, but they still rely on the fundamental idea that market participants collectively respond to certain price zones.
At the same time, the democratization of data and charting tools, including those offered by major brokers and fintech platforms, has allowed retail investors in regions from the United States and Canada to Europe, Asia, and Africa to monitor key levels with the same granularity as many professionals. This broader participation can sometimes strengthen widely watched support and resistance zones, as more orders cluster around them.
For FinancialDailys, which closely follows innovation in its tech and startups coverage, the intersection of AI, market structure, and technical analysis is an area of growing importance. Understanding how algorithms respond to liquidity and price levels can help investors anticipate intraday volatility and manage execution risk.
Common Misconceptions and Limitations
Despite their usefulness, support and resistance are often misapplied or misunderstood. One common misconception is that these levels are precise, immutable lines that the market must respect. In reality, they are zones of increased probability, and prices frequently overshoot or undershoot them before reversing. Treating them as absolute boundaries can lead to premature or overly confident decisions.
Another misconception is that a single touch or brief pause at a price level is enough to establish meaningful support or resistance. Most professional technicians, including those trained through organizations like CMT Association, look for multiple touches, clear reactions, and confirmation through volume or broader market context before assigning significant weight to a level.
It is also important to recognize that macroeconomic shocks, policy surprises, and geopolitical events can render historical support and resistance levels temporarily irrelevant. When central banks announce unexpected rate decisions, governments unveil major fiscal packages, or geopolitical tensions escalate rapidly, price can gap through previously respected levels. In such environments, risk management and scenario planning become even more critical.
Readers of FinancialDailys who follow global developments through its world and economy sections are well aware that structural shifts, such as energy transitions, demographic changes, and technological disruption, can reshape the long-term ranges within which assets trade, eventually redefining what constitutes meaningful support or resistance.
Practical Application for Long-Term Investors and Traders
Support and resistance can be applied differently depending on time horizon. Short-term traders often focus on intraday or multi-day levels, using them to guide entries, exits, and stop placements within relatively narrow ranges. They may rely on shorter-term moving averages, recent swing highs and lows, and real-time order book data.
Long-term investors, by contrast, typically focus on weekly or monthly charts, using support and resistance to identify broader accumulation or distribution zones. For example, a diversified investor monitoring global equities through FinancialDailys might look at multi-year support levels on major indices in the United States, Europe, and Asia to determine when to increase or decrease equity exposure in response to macroeconomic conditions.
In both cases, the principles of confirmation, confluence, and risk management remain central. Many experienced practitioners seek alignment between multiple indicators-such as horizontal support, moving averages, and macroeconomic catalysts-before acting decisively. They also remain aware of liquidity conditions, earnings calendars, and policy events that could cause abrupt moves through established levels.
Building a Trustworthy Process Around Support and Resistance
Ultimately, the value of support and resistance depends on how systematically and responsibly they are used. For the global audience of FinancialDailys, spanning investors, professionals, entrepreneurs, and policy observers across North America, Europe, Asia, Africa, and South America, the goal is not to predict every market turn, but to make better-informed, probability-based decisions.
A trustworthy process typically includes consistent time frames, clear rules for drawing and validating levels, integration with fundamental and macro analysis, explicit risk limits, and ongoing review. It also requires intellectual humility: acknowledging that no level is guaranteed to hold, that market regimes can change, and that diversification and risk control remain indispensable.
As financial markets continue to evolve, with growing emphasis on sustainability, digitalization, and global interconnection, the need for disciplined frameworks becomes even more pressing. Investors who complement their understanding of earnings, cash flows, and macroeconomic trends with a thoughtful application of support and resistance will be better equipped to navigate volatility, identify opportunities, and protect capital.
For those who regularly engage with the in-depth reporting and analysis on FinancialDailys, from investing and markets to sustainability and finance, integrating these technical insights into a broader, evidence-based perspective can provide a powerful edge. In an era defined by rapid information flow and complex interdependencies, understanding where markets have previously found balance-and where they may do so again-remains a cornerstone of informed, resilient, and opportunity-focused investing.
